| Characteristic | 2022 vs 2021 | 2023 vs 2022 |
|---|---|---|
| - | - | - |
| - | - | - |
| - | - | - |
The chart is not accessible to screen readers. Please switch to the table view to access the data.
Download
Source
Source
Release date
March 2023
More information
Region
China
Survey time period
December 2022
Number of respondents
50 companies
Supplementary notes
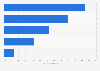
Survey question: How did the marketing budget of your company change in 2022 and how will it change in 2023?
,br>
The survey covered traditional brands like food & beverages, cosmetics, household appliances, etc. and brands present online such as online shopping, news, and life services.
Citation formats