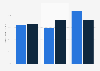
| Characteristic | 2013 | 2014 | 2015 | 2016 | 2017 |
|---|---|---|---|---|---|
| - | - | - | - | - | - |
| - | - | - | - | - | - |
| - | - | - | - | - | - |
| - | - | - | - | - | - |
| - | - | - | - | - | - |
| - | - | - | - | - | - |
| - | - | - | - | - | - |
| - | - | - | - | - | - |
The chart is not accessible to screen readers. Please switch to the table view to access the data.
Download
Source
Sources
Release date
January 2018
More information
Region
United Kingdom
Survey time period
2013 to 2017
Number of respondents
117*
Special properties
for-profit marketers (B2B and B2C)**
Method of interview
Email survey
Supplementary notes
* n (July to August 2013) = 198; n (July to August 2014) = 134; n (July to August 2014) = 133; n (July to August 2016) = 87; n (June to July 2017) = 117
** In 2016, marketers were contacted using lists from Content Marketing Institute, MarketingProfs, The Association for Data-driven Marketing & Advertising (ADMA), and WTWH Media.
Data for years previous to 2017 were published in earlier editions of the report.
Citation formats