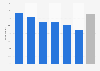
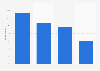
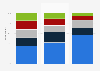
| Characteristic | More likely to view it positively | No real effect either way | More likely to view it negatively |
|---|---|---|---|
| - | - | - | - |
| - | - | - | - |
The chart is not accessible to screen readers. Please switch to the table view to access the data.
Download
Source
Source
Release date
March 2026
More information
Region
United States
Survey time period
January 29 to February 1, 2024, and March 27 to 30, 2026
Number of respondents
1,859*
Age group
18 years and older
Supplementary notes
* Number of respondents in 2026. In 2024, the source surveyed 1,489 adults.
Percentage points exceeding 100 percent are probably due to rounding.聽
The source does not specify the type of the survey.
Citation formats