| Characteristic | Share of respondents |
|---|---|
| - | - |
| - | - |
| - | - |
| - | - |
| - | - |
The chart is not accessible to screen readers. Please switch to the table view to access the data.
Download
Source
Sources
Release date
June 2023
More information
Region
United States
Survey time period
March to April, 2023
Number of respondents
799 to 8,434
Age group
18 years and older
Special properties
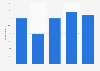
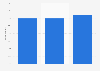
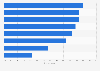
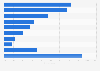
Share of respondents who trust each measured brand to do the right thing 鈥渁 lot鈥� and 鈥渟ome鈥� was subtracted from the share who said 鈥渘ot much鈥� and 鈥渘ot at all,鈥� and then averaged across all brands measured
Supplementary notes
Survey type not specified.
Brands in the aerospace and defense, chemicals, energy, health, medical devices, military, nonprofit, pharmaceutical and semiconductor sectors were excluded from the analysis; service-based children brands were also excluded.
Citation formats