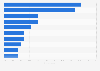
| Characteristic | 2011 | 2012 | 2013 |
|---|---|---|---|
| - | - | - | - |
| - | - | - | - |
| - | - | - | - |
| - | - | - | - |
| - | - | - | - |
| - | - | - | - |
| - | - | - | - |
| - | - | - | - |
| - | - | - | - |
| - | - | - | - |
| - | - | - | - |
| - | - | - | - |
| - | - | - | - |
| - | - | - | - |
| - | - | - | - |
| - | - | - | - |
The chart is not accessible to screen readers. Please switch to the table view to access the data.
Download
Source
Sources
Release date
February 2014
More information
Region
United Kingdom
Survey time period
2011 to 2013**
Number of respondents
128***
Special properties
marketers
Method of interview
Online survey
Supplementary notes
* 'Mobile applications', 'Public relations' and 'SMS' are new options added in 2013.
** Dates of most recent survey were October, November and December 2013.
*** n (2012) = 161; n (2013) = 128.
Data for 2011 published earlier by the source.
Citation formats