| Characteristic | Share of respondents |
|---|---|
| - | - |
| - | - |
| - | - |
| - | - |
| - | - |
| - | - |
| - | - |
| - | - |
| - | - |
| - | - |
| - | - |
| - | - |
| - | - |
| - | - |
| - | - |
| - | - |
| - | - |
| - | - |
| - | - |
| - | - |
| - | - |
The chart is not accessible to screen readers. Please switch to the table view to access the data.
Download
Source
Source
Release date
August 2017
More information
Region
Australia
Survey time period
March 2017
Number of respondents
>2,000
Age group
14 years and older
Method of interview
Online interview
Supplementary notes
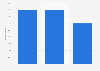
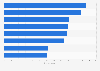
Question: "To what degree do the following influence your buying decisions?". Figures represent the share of respondents describing the medium as having a high or medium influence.
Citation formats