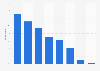
| Characteristic | Share of respondents |
|---|---|
| Consistently high-quality products | 62% |
| They make me feel appreciated/valued | 44% |
| They understand my preferences | 43% |
| They prioritize their customers | 43% |
| They remember my history with the brand | 37% |
| They respect how and when I want to hear from them | 32% |
| I feel like I'm part of their community | 27% |
| Other | 1% |
The chart is not accessible to screen readers. Please switch to the table view to access the data.
Loading statistic...
Download
Source
Sources
Release date
July 2025
More information
Region
Australia, United Kingdom, United States
Survey time period
January 2025
Number of respondents
3,300 respondents
Age group
18 years and older
Special properties
among smartphone owners receiving text messages and emails from brands and who made at least three online purchases during the three months preceding the survey
Method of interview
Online survey
Supplementary notes
Multiple answers were possible.
Number of respondents per country:
Australia: n = 300
United Kingdom: n = 1,000
United States: n = 2,000
Citation formats