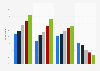
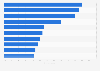
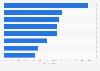
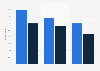
| Characteristic | Share of brands |
|---|---|
| - | - |
| - | - |
| - | - |
| - | - |
| - | - |
| - | - |
| - | - |
| - | - |
| - | - |
| - | - |
| - | - |
| - | - |
| - | - |
| - | - |
| - | - |
| - | - |
| - | - |
| - | - |
The chart is not accessible to screen readers. Please switch to the table view to access the data.
Download
Source
Source
Release date
October 2015
More information
Region
United States
Survey time period
September 2015
Number of respondents
40,128 respondents
Age group
18-65 years
Supplementary notes
The source states that "75 percent [of respondents] were interviewed by phone, 20 percent via face-to-face interviews (to account for cell phone-only consumers), and remaining consumers assessed categories and brands online. The 2015 Loyalty Leader assessments examined 68 categories and 753 brands."
Citation formats