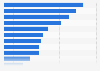
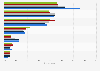
| Characteristic | Clothing | Electronics | Exercise equipment | Food | Household goods | Makeup* |
|---|---|---|---|---|---|---|
| - | - | - | - | - | - | - |
| - | - | - | - | - | - | - |
| - | - | - | - | - | - | - |
| - | - | - | - | - | - | - |
| - | - | - | - | - | - | - |
The chart is not accessible to screen readers. Please switch to the table view to access the data.
Download
Source
Source
In cooperation with
DISQO
Release date
October 2022
More information
Region
United States
Survey time period
June 1 to 15, 2022
Number of respondents
44,167 respondents
Special properties
among online shopping video watchers**
Supplementary notes
* For the Gen X and Silent generations, the source did not provide the exact number for makeup. The category "toys" was excluded from this chart due to lack of data at the source. For these reasons, the totals do not add up to 100 percent.
** Respondents who answered "Yes" to: 鈥淗ave you ever watched an online live or pre-recorded video shopping event?鈥�
Citation formats