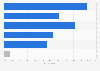
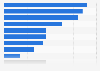
| Characteristic | Sales index |
|---|---|
| - | - |
| - | - |
| - | - |
| - | - |
| - | - |
| - | - |
The chart is not accessible to screen readers. Please switch to the table view to access the data.
Download
Source
Source
Release date
November 2020
More information
Region
United Kingdom
Survey time period
2014 to 2019
Supplementary notes
Index values for 2019 are calculated in comparison to average in October 1-28, 2019. 2018 values are compared to averages in October of the same year. Data for years prior to 2018 were taken from insights also published by the same source . Baseline for sales data from 2014 to 2017 was comparison to average daily sales between November 1 and November 14 of each year."
The source further indicates that sales data were gathered from more the 5,000 retail advertisers in 35 countries, over 2 billion transactions made in Q4 2019.
No date of release was given for data. In this statistic, data of access is used.
Citation formats