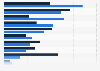
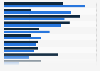
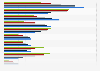
| Characteristic | Avg. number of live shows attended |
|---|---|
| - | - |
| - | - |
| - | - |
| - | - |
The chart is not accessible to screen readers. Please switch to the table view to access the data.
Download
Source
Source
In cooperation with
McKinsey & Company
Release date
August 2023
More information
Region
Worldwide
Survey time period
August to September 2022
Supplementary notes
Q: "How many live-shopping shows have you attended in the past 12 months?"
Citation formats