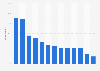
| Characteristic | Percentage of respondents |
|---|---|
| - | - |
| - | - |
| - | - |
The chart is not accessible to screen readers. Please switch to the table view to access the data.
Download
Source
Source
Release date
March 2019
More information
Region
Worldwide
Survey time period
November 27 to December 15, 2018
Number of respondents
3,525 respondents
Special properties
customer service agents and decision makers.
Supplementary notes
Type of survey and age of respondents not indicated.
High performers- rate their company's customer satisfaction as excellent
Underperformers- rate their company's customer satisfaction as average or below
Moderate Performers- all other customer service professionals
Citation formats