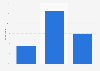
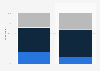
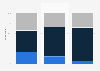
| Characteristic | After a very good experience | After a very poor experience |
|---|---|---|
| - | - | - |
| - | - | - |
| - | - | - |
| - | - | - |
| - | - | - |
The chart is not accessible to screen readers. Please switch to the table view to access the data.
Download
Source
Source
Release date
December 2024
More information
Region
Worldwide
Survey time period
Q3 2024
Number of respondents
23,730 respondents
Method of interview
Panel survey
Supplementary notes
The source does not specify respondents鈥� age.
The survey included 23,730 consumers across 23 markets: Australia, Brazil, Canada, China, Denmark, France, Germany, Hong Kong, India, Ireland, Italy, Japan, Mexico, the Netherlands, New Zealand, the Philippines, Singapore, South Korea, Spain, Sweden, the United Arab Emirates, the United Kingdom, and the United States. Each market had 1,200 respondents, except for Hong Kong with 400, New Zealand with 600, the Philippines and Denmark with 660, Ireland with 700, and Singapore and the UAE with 800.
Multiple answers were possible.
Citation formats