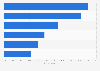
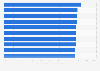
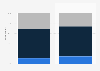
| Characteristic | Share of respondents with a favorable opinion |
|---|---|
| - | - |
| - | - |
| - | - |
| - | - |
| - | - |
| - | - |
| - | - |
| - | - |
| - | - |
| - | - |
The chart is not accessible to screen readers. Please switch to the table view to access the data.
Download
Source
Source
Release date
September 2022
More information
Region
United States
Survey time period
May 1 to August 21, 2022
Number of respondents
2,031*
Supplementary notes
* The source interviewed 2,031 adults from Generation Z (born between 1997 and 2004), but it does not provide a separate number of respondents for men or women only.
Citation formats