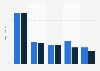
| Characteristic | Share of advertising impressions |
|---|---|
| - | - |
| - | - |
| - | - |
| - | - |
| - | - |
The chart is not accessible to screen readers. Please switch to the table view to access the data.
Download
Source
Sources
Release date
January 2022
More information
Region
United States
Survey time period
Q4 2021
Supplementary notes
Data is based on anonymized performance data from Facebook programs under the source's management, with annual digital ad spend under management totaling over three billion U.S. dollars during Q4 2021. Broader industry metrics may vary.
Citation formats