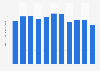
| Characteristic | Estimated revenue in billion U.S. dollars |
|---|---|
| '23* | 142.43 |
| '22 | 170.96 |
| '21 | 153.4 |
| '20 | 138.12 |
| '19 | 137.93 |
| '18 | 128.94 |
| '17 | 117.62 |
| '16 | 110.45 |
| '15 | 102.08 |
| '14 | 97.85 |
| '13 | 92.76 |
| '12 | 87.34 |
| '11 | 82.12 |
| '10 | 81.2 |
| '09 | 77.43 |
| '08 | 86.83 |
| '07 | 87.43 |
| '06 | 79.11 |
| '05 | 71.19 |
| '04 | 65.93 |
The chart is not accessible to screen readers. Please switch to the table view to access the data.
February 2026
United States
2004 to 2023
including ad, PR, and media buying agencies, media representatives, outdoor advertising, and direct mail advertising companies, ad material distribution services, and other services related to advertising
* The Annual Integrated Economic Survey (AIES) replaced the Service Annual Survey (SAS) beginning with survey year 2023. Unlike SAS, which covered only services, AIES uses a company-based reporting unit spanning retail, wholesale, manufacturing, and services, with wording that can introduce level shifts in otherwise comparable series. The survey also adds subnational state and regional estimates with no SAS equivalent, and from 2025 onward transitions from 2017 to 2022 North American Industry Classification System (NAICS) codes while introducing North American Product Classification System (NAPCS) product data. Because no formal bridge study links the final SAS (2022) to the first AIES (2023), the transition must be treated as a structural break rather than a seamless continuation.
Data preceding 2023 retrieved from earlier SAS releases.
Numbers have been rounded.