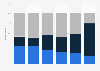
| Characteristic | Share of respondents |
|---|---|
| - | - |
| - | - |
| - | - |
| - | - |
| - | - |
The chart is not accessible to screen readers. Please switch to the table view to access the data.
Download
Source
Sources
Release date
January 2026
More information
Region
United States
Survey time period
November 2025
Number of respondents
505 consumers
Age group
8-14 years
Supplementary notes
This question was phrased by the source as follows: "When a brand says it鈥檚 鈥渄oing good,鈥� how can you tell it鈥檚 real?"
Two answers were possible.
Citation formats