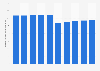
| Characteristic | Number of respondents in thousands |
|---|---|
| Bus | 20,534 |
| Billboards | 18,870 |
| Bus stops | 18,721 |
| Street furniture/illuminated advertising | 13,005 |
| Outdoor/street clocks | 12,171 |
| Single-pole billboard | 12,105 |
| Shopping centers | 8,798 |
| Newsstands | 7,300 |
| Large urban furniture | 6,820 |
| Morris columns | 6,405 |
| Neon signs on buildings | 6,124 |
| Building banner | 6,062 |
| Advertising flag | 5,298 |
| Screens in lottery/gambling establishments | 5,030 |
| Car parks | 4,992 |
| Containers | 4,887 |
| Subway cars | 4,040 |
| Subway stations | 3,844 |
| Subway screens | 2,811 |
| Trains | 2,524 |
| Taxis | 2,142 |
| Airports | 1,183 |
| Bicycles | 1,051 |
The chart is not accessible to screen readers. Please switch to the table view to access the data.
Loading statistic...
Download
Source
Source
Release date
December 2022
More information
Region
Spain
Survey time period
January to November 2022
Number of respondents
30,000*
Age group
14 years and older
Special properties
weekly exposure
Supplementary notes
* 25,500 interviewed face-to-face and 4.500 surveyed online.
Citation formats