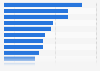
| Characteristic | Share of respondents |
|---|---|
| Apparel | 37 |
| Beauty and personal care | 37 |
| Restaurants / dining out / bars | 35 |
| Footwear | 29 |
| Groceries | 28 |
| Jewelry and accessories | 28 |
| Travel | 25 |
| Entertainment at home | 24 |
| Home electronics | 23 |
| Out-of-home entertainment | 23 |
| Home goods | 20 |
| Household essentials | 17 |
| Vehicles | 16 |
| Fitness | 16 |
| Alcoholic beverages | 14 |
| Over-the-counter medicine | 14 |
| Pet food and supplies | 13 |
| Toys | 12 |
The chart is not accessible to screen readers. Please switch to the table view to access the data.
Loading statistic...
Download
Source
Source
In cooperation with
McKinsey & Company
Release date
December 2024
More information
Region
United States
Survey time period
November 2024
Number of respondents
2,044 respondents
Supplementary notes
*As the survey dates to November, 2024, the next three months would be December 2024, January 2025, and February 2025.
The question was phrased in the following way: 'You mentioned that you plan to splurge/treat yourself over the next 3 months. For which products or services do you expect to make more expensive purchases than normal or purchase something to treat yourself? Please select all that apply.'
Citation formats