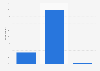
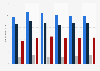
| Characteristic | Regularly | Periodically | Never |
|---|---|---|---|
| - | - | - | - |
| - | - | - | - |
| - | - | - | - |
| - | - | - | - |
| - | - | - | - |
| - | - | - | - |
| - | - | - | - |
| - | - | - | - |
| - | - | - | - |
| - | - | - | - |
| - | - | - | - |
| - | - | - | - |
Download
Source
Source
In cooperation with
Hub Entertainment Research
Release date
November 2022
More information
Region
United States
Survey time period
October 2022
Number of respondents
*
Age group
35-74 years
Special properties
Household decision-maker/shares in decisions on entertainment, have broadband access, U.S. census balanced
Supplementary notes
*Sample count for sources used by statistic 鈥� YOUTUBE TV (n=81), AMAZON PRIME (n=1,083), NETFLIX (n=1,269), SPOTIFY PAID (n=186), HULU + LIVE TV (n=102), EA PLAY/PLAY PRO (n=35), SUBSCRIPTION TO SPECIFIC GAME (n=190), GOOGLE PLAY PASS (n=74), AMC+ (n=41), AT&T UVERSE TV (n=87).
**EA Play represents both EA Play and EA Play Pro.
***QR19. We鈥檇 like to know which sources of entertainment you currently pay for in your household are a 鈥済iven鈥� 鈥� ones you don鈥檛 seriously consider canceling month-to-month, and which are constantly under scrutiny.
Citation formats