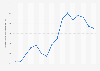
| Characteristic | Revenue per user in U.S. dollars |
|---|---|
| - | - |
| - | - |
| - | - |
| - | - |
| - | - |
| - | - |
The chart is not accessible to screen readers. Please switch to the table view to access the data.
Download
Source
Source
Release date
May 2022
More information
Region
United States
Survey time period
2019 to 2021
Supplementary notes
* Forecast.
Among TikTok users via any device at least once per month. Includes paid advertising only. Excludes spending by marketers that goes toward developing or maintaining a TikTok presence.
Citation formats