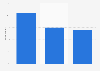
| Characteristic | Share of respondents |
|---|---|
| - | - |
| - | - |
| - | - |
| - | - |
| - | - |
The chart is not accessible to screen readers. Please switch to the table view to access the data.
Download
Source
Source
Release date
September 2019
More information
Region
United States
Survey time period
May 16 to 22, 2019
Number of respondents
1,012 respondents
Method of interview
Online survey
Supplementary notes
Question: Which video delivery medium do consumers see the most diversity in advertising?
Citation formats