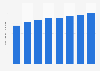
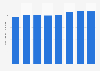
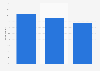
| Characteristic | Share of short-term return* |
|---|---|
| - | - |
| - | - |
| - | - |
| - | - |
| - | - |
The chart is not accessible to screen readers. Please switch to the table view to access the data.
Download
Source
Sources
Release date
November 2017
More information
Region
United Kingdom
Survey time period
February 2014 to May 2017
Supplementary notes
* Share of profit delivered in the short term (throughout the campaign and for a period of circa three months afterwards)
Figures are based on data from 150 of Ebiquity's clients with analyses covering 606 campaings.
The source adds the following information: "Online video includes broadcaster VOD, YouTube, Facebook video & online programmatic video."
Citation formats