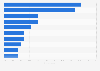
| Frequency of e-mails sent | Share of respondending companies |
|---|---|
| - | - |
| - | - |
| - | - |
| - | - |
The chart is not accessible to screen readers. Please switch to the table view to access the data.
Download
Source
Source
Release date
November 2016
More information
Region
Netherlands
Survey time period
March 19, 2016 to April 19, 2016
Number of respondents
50 respondents
Special properties
brands were monitored for four weeks including Easter and Spring break; 50 leading e-commerce brands were selected from Prisync and by a local research team
Citation formats