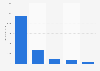
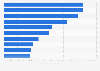
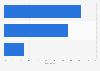
| Characteristic | Share of respondents |
|---|---|
| Mid-tier individual influencers and creators | 46% |
| Small accounts | 38% |
| Mega influencers and internet celebrities | 6% |
| Entertainers, celebrities and other pop culture personalities | 2% |
| Brand officials or company spokespersons | 2% |
| Journalists, pundits and media outlets | 0.4% |
| Industry professionals or experts | 0.3% |
| Nonprofit organizations | 0.2% |
| Politicians, officials and government agencies | 0.1% |
The chart is not accessible to screen readers. Please switch to the table view to access the data.
Loading statistic...
Download
Source
Source
Release date
October 2024
More information
Region
United States
Survey time period
April 8 to 16, 2024, and June 14 to 20, 2024
Number of respondents
664 respondents
Age group
18 years and older
Special properties
accounts categorized through machine learning methods using publicly available account information and five latest videos posted by the account
Method of interview
Panel survey
Supplementary notes
The source analyzed 227,946 TikTok accounts.聽
The values may not sum up to 100 percent due to rounding.
Citation formats