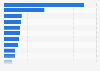
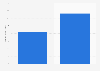
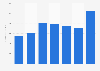
| Characteristic | Year-on-year growth rate |
|---|---|
| - | - |
| - | - |
| - | - |
| - | - |
| - | - |
| - | - |
| - | - |
| - | - |
| - | - |
| - | - |
| - | - |
| - | - |
| - | - |
| - | - |
| - | - |
| - | - |
| - | - |
| - | - |
| - | - |
| - | - |
The chart is not accessible to screen readers. Please switch to the table view to access the data.
Download
Source
Sources
Release date
March 2023
More information
Region
United States
Survey time period
Q4 2022
Special properties
large AdTech companies such as Google, Meta, or Snap excluded
Supplementary notes
The data is based on financial information of companies that:
- are publically traded in the United States,
- generate most of its revenue from digital media operations,
- process their payments via OAREX.
Citation formats