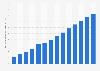
| Characteristic | Percentage of companies |
|---|---|
| - | - |
| - | - |
| - | - |
| - | - |
| - | - |
| - | - |
| - | - |
| - | - |
The chart is not accessible to screen readers. Please switch to the table view to access the data.
Download
Source
Source
Release date
February 2026
More information
Region
Slovenia
Survey time period
2014 - 2025
Special properties
companies with 10 or more employees (excluding those in the financial sector)
Supplementary notes
The metadata corresponding to this series is available at the following link.
*The source does not provide data for 2018, 2020, 2022 and 2024.
Citation formats