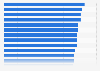
| Characteristic | Share of respondents |
|---|---|
| Pantry items (pasta, canned goods, snacks, etc.) | 30.3% |
| Household cleaning supplies | 20.3% |
| Over-the-counter medicine | 19.8% |
| Personal care (soap, shampoo, body cream, etc.) | 18.8% |
| Apparel (jeans, T-shirts, underwear, socks, etc.) | 15.1% |
| Meat and poultry | 13.1% |
| Beauty products (makeup, face cream, fragrances, etc.) | 8.5% |
| Pet food and supplies | 7.6% |
| Footwear (slippers, boots, running shoes, etc.) | 7.3% |
| Home furnishings (bath towels, decorative pillows, duvets, etc.) | 6% |
| Electronics and accessories (TV, batteries, ear pods, etc.) | 4.8% |
| Accessories (handbags, backpacks, belts, wallets, etc.) | 4.4% |
| Have always purchased private label brands | 28.6% |
| Tried private label once, but did not switch | 12.5% |
| Other | 0.2% |
The chart is not accessible to screen readers. Please switch to the table view to access the data.
Loading statistic...
Download
Source
Sources
Release date
March 2022
More information
Region
United States
Survey time period
January 3 to 11, 2022
Number of respondents
969 respondents
Age group
18 years and older
Special properties
Switched in the past 6 months
Method of interview
Online survey
Supplementary notes
Multiple answers were possible
Citation formats