| Characteristic | Share of respondents |
|---|---|
| - | - |
| - | - |
The chart is not accessible to screen readers. Please switch to the table view to access the data.
Download
Source
Source
In cooperation with
DISQO
Release date
April 2022
More information
Region
United States
Survey time period
March 2022
Number of respondents
53,749 respondents*
Special properties
consumers who had at least five digital shopping behaviors in a given product category over a 30-day period
Supplementary notes
* Nationally representative.
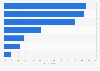
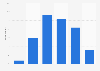
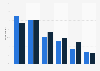
Opted-in members of DISQO鈥檚 customer insights platform were asked: "Have you shopped for [automobiles/travel/groceries] online in the past 30 days?"
Their answers were later compared to data on their actual digital behaviors collected over the same, backward-looking 30-day period and the behavioral data was matched to individual survey respondents. Keyword searches, website visits, and mobile app launches were tallied across lists of keywords, websites, and apps in the three study categories. Each consumer who had five or more of these digital events was labeled an "Active Shopper."
According to the source: "The Say-
Do Gap represents the difference between
what someone says they did and what they
actually did. It may represent an error in
their recollection, or it may be that for some
reason鈥� the respondent misrepresents their
actual behavior. This may relate to a belief
system about behaviors they aspire to or
feelings about being judged for what they
actually do."
Citation formats