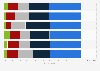
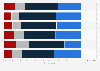
| Characteristic | Predicted percentage change |
|---|---|
| - | - |
| - | - |
| - | - |
| - | - |
| - | - |
| - | - |
| - | - |
The chart is not accessible to screen readers. Please switch to the table view to access the data.
Download
Source
Source
Release date
March 2017
More information
Region
Denmark
Survey time period
February 2017
Supplementary notes
This statistic is based on a survey of 1,031 respondents aged 18 years and older, consulted via computer-assisted web interviews.
The original question was phrased by the source as follows: "Hvordan tror du dit brug af kundeservice vil se ud om et 氓r - mere, mindre eller u忙ndret?"
Citation formats