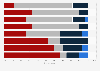
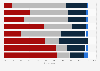
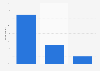
| Characteristic | Share of respondents who answered "much more frequently" or "somewhat more frequently" |
|---|---|
| - | - |
| - | - |
| - | - |
| - | - |
| - | - |
| - | - |
| - | - |
| - | - |
| - | - |
| - | - |
| - | - |
| - | - |
The chart is not accessible to screen readers. Please switch to the table view to access the data.
Download
Source
Sources
Release date
August 2016
More information
Region
United States
Survey time period
August 2016
Number of respondents
498 respondents
Age group
25 years and older
Method of interview
Online survey
Supplementary notes
Original question: "What impact, if any, would these types of recommendations and offers have on how frequently you shop with each of these retailers or companies?"
Values may not add up to 100 percent due to rounding.
Citation formats