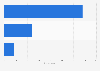
| Characteristic | Share of respondents |
|---|---|
| - | - |
| - | - |
| - | - |
The chart is not accessible to screen readers. Please switch to the table view to access the data.
Download
Source
Sources
Release date
May 2019
More information
Region
North America
Survey time period
February 2019
Number of respondents
100 respondents
Supplementary notes
Question: In 2019, how has your ecommerce marketing budget changed when compared to 2018?
Citation formats