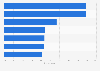
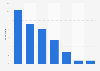
| Characteristic | Share of respondents |
|---|---|
| Recommended a product, service or company to someone | 47% |
| Chosen a product or service from a company or brand because of good experiences I have had with them | 45% |
| Avoided a company or brand because of a bad experience I have had | 39% |
| Been asked for advice by family or friends about what to buy | 32% |
| Advised someone against a brand or company | 29% |
| Chosen a product or service from a company or brand because I heard or read about someone else's good experiences | 24% |
| Avoided a company or brand because I heard or read about someone else's bad experiences | 22% |
| Boycotted a company or brand as a protest because of how they treat their workers | 17% |
| Contacted a brand or company to complain about their product(s) or service(s) | 16% |
| Changed someone's mind about purchasing a brand or company | 16% |
| Boycotted a company or brand as a protest because of how they treat the environment | 12% |
| Shared your views about a company or brand via media/blogs/social media | 12% |
| Boycotted a brand or company as a protest against them avoiding paying tax | 7% |
| Bought a product or service because they support a particular charity or cause | 6% |
| Bought a brand, product or service because they are endorsed by a celebrity you admire or trust | 1% |
The chart is not accessible to screen readers. Please switch to the table view to access the data.
Loading statistic...
Download
Source
Source
Release date
June 2014
More information
Region
Germany
Survey time period
September 3-17 and October 1-15, 2013
Number of respondents
1,000+ per wave*
Age group
16-64 years
Special properties
online adults
Method of interview
Online panel
Supplementary notes
* Research was carried out in two waves. The source indicates the survey was conducted with questions put to a total sample of 16,039 adults across 20 countries in September 2013 or to a sample of 16,167 adults in October 2013.
Approximately 1000+ individuals were surveyed in Australia, Brazil, Canada, China, France, Germany, India, Italy, Japan, Spain, Great Britain and the United States of America, and approximately 500+ individuals were surveyed in Argentina, Belgium, Poland, Russia, Saudi Arabia, South Korea, Sweden and Turkey.
Data has been weighted to the known national populations.
Where results do not sum to 100, this may be due to computer rounding, multiple responses or the exclusion of don't knows or not stated responses.
Citation formats