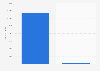
| Characteristic | Link | Photo | Video | Status | Album |
|---|---|---|---|---|---|
| 2021 | 38.78% | 38.58% | 15.51% | - | 7.13% |
| 2020 | 44.2% | 34.73% | 15.09% | 0% | - |
| 2019 | 41.25% | - | 14.83% | 1.23% | - |
| 2018 | 43.95% | 38.88% | 14.8% | 2.02% | - |
| 2017 | 45.7% | 48.74% | 12.96% | 2% | - |
| 2016 | 37.19% | 46.86% | 13.04% | 2.22% | - |
| 2015 | 37.8% | 48.52% | 8.63% | 4.04% | - |
| 2014 | 29.85% | 58.56% | 5.47% | - | - |
The chart is not accessible to screen readers. Please switch to the table view to access the data.
Loading statistic...
Download
Source
Source
Release date
July 2021
More information
Region
Worldwide
Survey time period
2014 to May 2021
Supplementary notes
No values available for 2014 status and 2019 photo.
"To identify the best strategy for video content on Facebook, we analyzed more than 3,977,401 of video posts from a total of 503,175 business pages. Within this report, we provide a representative sample of US and international brands that had an active presence on Facebook between 2014 and May 2021. These pages had Facebook fan counts between 1,000 and over 100K as of the same date."
Citation formats