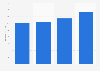
| Characteristic | Including Belarus & Russia | Excluding Belarus & Russia* |
|---|---|---|
| - | - | - |
| - | - | - |
| - | - | - |
| - | - | - |
| - | - | - |
| - | - | - |
| - | - | - |
| - | - | - |
| - | - | - |
| - | - | - |
| - | - | - |
| - | - | - |
The chart is not accessible to screen readers. Please switch to the table view to access the data.
Download
Source
Source
In cooperation with
IAB Europe
Release date
May 2025
More information
Region
Europe
Survey time period
2013 to 2024
Supplementary notes
* Historical market size restated based on 2022 constant exchange rates and historical growth rates. In 2021, Estonia, Latvia, and Lithuania were added. Their combined digital advertising revenue stood at 339 million euros.
Data for the timeline which includes Russia and Belarus was retrieved from an earlier publication.
Citation formats