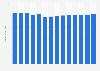
| Characteristic | Share of contacts |
|---|---|
| - | - |
| - | - |
| - | - |
| - | - |
The chart is not accessible to screen readers. Please switch to the table view to access the data.
January 2016
United Kingdom
October 2015
1,000 respondents
UK households who contacted their Pay TV provider
Online survey
This question was phrased by the source as follows: "And more specifically, which of the following best describes what the issue with [PROVIDER] was concerning?"
*The source adds the following information: "Respondents were shown a different list of reasons to choose from dependent on whether they said their most recent contact was regarding a billing, fault and repair or general issue. To enable a comparison the data in Figure 15 was expressed as a proportion of all those that had contacted their pay TV provider in the 3 months prior to the interview (July to September 2015)"