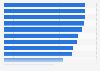
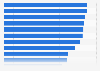
| Characteristic | 2014 | 2015 |
|---|---|---|
| - | - | - |
| - | - | - |
| - | - | - |
| - | - | - |
| - | - | - |
| - | - | - |
The chart is not accessible to screen readers. Please switch to the table view to access the data.
Download
Source
Source
Release date
March 2016
More information
Region
Canada
Survey time period
2014 and 2015
Number of respondents
1,000 respondents
Method of interview
Online interview
Supplementary notes
The source does not specify the date of the survey.
The source has only reported the top five survey responses for each year.
Data from 2014 is taken from a rpevious report.
Citation formats