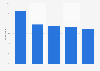
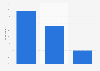
| Characteristic | Top-2 reasons | All reasons |
|---|---|---|
| - | - | - |
| - | - | - |
| - | - | - |
| - | - | - |
| - | - | - |
| - | - | - |
| - | - | - |
| - | - | - |
| - | - | - |
| - | - | - |
The chart is not accessible to screen readers. Please switch to the table view to access the data.
Download
Source
Source
Release date
November 2012
More information
Region
United States
Survey time period
April 2012
Number of respondents
base: n = 9,215 attendees and 885 exhibitors*
Special properties
domestic and international participants from a sampling of the top 250 business-to-business exhibitions*
Method of interview
Online survey
Supplementary notes
* This includes a sampling of attendees and exhibitors from 27 of the top 250 exhibitions as well as a sampling of exhibitors from Exhibitrac鈥檚 top 250 exhibitions database.
Citation formats