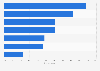
| Characteristic | Share of retailers preferring method |
|---|---|
| - | - |
| - | - |
| - | - |
| - | - |
| - | - |
| - | - |
| - | - |
| - | - |
The chart is not accessible to screen readers. Please switch to the table view to access the data.
Download
Source
Source
Release date
October 2020
More information
Region
Singapore
Survey time period
Q1 to Q2 2020
Number of respondents
13,000 respondents
Special properties
survey was conducted among conumers and businesses across Thailand, Vietnam, the Philippines, and Singapore
Supplementary notes
*Encouraging the audience to share social media posts by providing gifts or coupons.
**Implementation of a buyer ranking system or customer feedbacks.
Citation formats