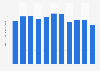
| Characteristic | Share of respondents |
|---|---|
| - | - |
| - | - |
| - | - |
| - | - |
| - | - |
The chart is not accessible to screen readers. Please switch to the table view to access the data.
Download
Source
Source
Release date
April 2020
More information
Region
United States
Survey time period
April 1 to 8, 2020
Number of respondents
205 respondents
Special properties
among media publishers, media platforms and programmatic companies
Supplementary notes
Original questions: Please select the top five categories you project will be the hardest hit / have the greatest negative impact against your original 2020 plan?
Citation formats