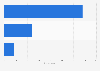
| Characteristic | Financial prospects for your company compared with 3 months ago | Financial prospects for your industry compared with 3 months ago |
|---|---|---|
| - | - | - |
| - | - | - |
| - | - | - |
| - | - | - |
| - | - | - |
| - | - | - |
| - | - | - |
| - | - | - |
| - | - | - |
| - | - | - |
| - | - | - |
| - | - | - |
| - | - | - |
| - | - | - |
| - | - | - |
| - | - | - |
| - | - | - |
| - | - | - |
| - | - | - |
| - | - | - |
| - | - | - |
The chart is not accessible to screen readers. Please switch to the table view to access the data.
Download
Source
Sources
Release date
October 2020
More information
Region
United Kingdom
Survey time period
Q4 2014 to Q3 2020
Number of respondents
~300 per wave
Special properties
UK marketing executives/ professionals
Supplementary notes
* The source indicates that net balance is calculated by subtracting the percentage reporting negative prospects from the percentage reporting positive prospects.
The source does not specify the type of survey used.
Figures for some quarters were published earlier by various sources.
Citation formats