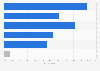
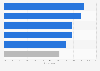
| "Important reason" | No, do not | Yes, do |
|---|---|---|
| - | - | - |
| - | - | - |
| - | - | - |
| - | - | - |
| - | - | - |
The chart is not accessible to screen readers. Please switch to the table view to access the data.
Download
Source
Source
Release date
November 2012
More information
Region
United States
Survey time period
November 15 to 18, 2012
Number of respondents
1,015 respondents
Age group
8-19 years
Method of interview
Telephone interview
Supplementary notes
Each sample includes a minimum quota of 400 cellphone respondents and 600 landline respondents per 1,000 national adults.
Missing percentage points to 100 percent were grouped in the category "no opinion".
Citation formats