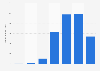


| Characteristic | Monthly revenue in U.S. dollars |
|---|---|
| - | - |
| - | - |
| - | - |
| - | - |
| - | - |
| - | - |
| - | - |
| - | - |
| - | - |
| - | - |
| - | - |
| - | - |
| - | - |
| - | - |
| - | - |
| - | - |
| - | - |
| - | - |
| - | - |
| - | - |
| - | - |
| - | - |
| - | - |
| - | - |
| - | - |
| - | - |
| - | - |
| - | - |
| - | - |
| - | - |
| - | - |
The chart is not accessible to screen readers. Please switch to the table view to access the data.
Download
Source
Source
In cooperation with
AppMagic
Release date
October 2023
More information
Region
Brazil
Survey time period
Q1 2019 to Q3 2023
Special properties
in-app purchase (IAP) revenue reduced by platform fees and inclusive taxes; combined revenue of iPhone/iPad App Store and Google Play
Supplementary notes
Values have been rounded,
Citation formats



