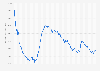
| Characteristic | Small businesses | Medium-sized businesses | Large businesses |
|---|---|---|---|
| H1 2018 | 104.4 | 157.9 | 614.5 |
| H2 2018 | 105.7 | 162.1 | 650.4 |
| H1 2019 | 108.6 | 165.6 | 683.5 |
| H2 2019 | 109.8 | 170.2 | 704.8 |
| H1 2020 | 113.3 | 173.3 | 728.2 |
| H2 2020 | 117.9 | 173.7 | 715.4 |
| H1 2021 | 122.7 | 182 | 741.2 |
| H2 2021 | 127.5 | 184.9 | 784.1 |
| H1 2022 | 137.9 | 201.7 | 838.8 |
| H2 2022 | 140.4 | 203.1 | 892.4 |
| H1 2023 | 142.1 | 207 | 932.5 |
| H2 2023 | 134.8 | 203.8 | 1,007.4 |
The chart is not accessible to screen readers. Please switch to the table view to access the data.
Loading statistic...
Download
Source
Source
Release date
October 2024
More information
Region
Canada
Survey time period
H1 2018 to H2 2023
Supplementary notes
Small businesses refers to those with loan authorization levels of less than one million Canadian dollars.
Medium-sized businesses refers to those with loan authorization levels of one million to five million Canadian dollars.
Large businesses refers to those with loan authorization levels of five billion Canadian dollars or more.
Adapted from Statistics Canada, Biannual Survey of Suppliers of Business Financing 鈥� Data analysis, page 7-8, H1 2018 to H2 2022 . This does not constitute an endorsement by Statistics Canada of this product.
Citation formats