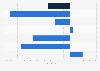
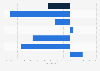
| Characteristic | Change in time spent per user session |
|---|---|
| - | - |
| - | - |
| - | - |
| - | - |
| - | - |
| - | - |
| - | - |
| - | - |
| - | - |
| - | - |
| - | - |
| - | - |
| - | - |
The chart is not accessible to screen readers. Please switch to the table view to access the data.
Download
Source
Source
Release date
April 2020
More information
Region
Worldwide
Survey time period
week 4/20 to 4/26 compared to reference (Jan 6 to Feb 16)
Number of respondents
1,400 sites
Special properties
4.8b sessions and 23b pages views over the last 11 weeks of 2020
Supplementary notes
According to the source, "our analysis is based on 7b sessions and 35b pages views over the last 15 weeks of 2020, from January 6 to April 19. We have compared behaviors across 20+ industries since the outbreak was first reported globally (week of Feb 17) compared to the period immediately before (first 6 weeks of the year: the reference period)."
Citation formats