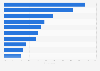
| Characteristic | Share of respondents |
|---|---|
| Watch TV | 58% |
| VoD services | 38% |
| Social media | 35% |
| Read books | 31% |
| Outdoor activities | 24% |
| Online news | 24% |
| Listen to radio | 24% |
| Exercise at home | 24% |
| Browse internet | 22% |
| Keep in contact with friends | 22% |
| Listen to music | 22% |
| Cooking | 19% |
| Studying | 17% |
| Play console games | 14% |
| House cleaning | 13% |
| Read newspapers | 13% |
| Read magazines | 11% |
| Handcrafts | 10% |
| Listen to audiobooks | 9% |
| Gardening | 5% |
| Other activities | 4% |
| Online shopping | 4% |
| Renovating | 4% |
| Furnishing | 2% |
The chart is not accessible to screen readers. Please switch to the table view to access the data.
Loading statistic...
Download
Source
Source
Release date
April 2020
More information
Region
Finland
Survey time period
March 24-26, 2020
Number of respondents
868 respondents
Age group
15-74 years
Method of interview
Online panel
Supplementary notes
This question was phrased by the source as follows: "Miten kulutat nyt poikkeustilanteen aikana vapaa-aikaasi kotona? Valitse maksimissaan 5 suosituinta ajankulutustapaasi t盲ll盲 hetkell盲?".
5 answers were possible.
The results have been weighted to represent the entire population.
Citation formats