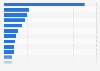
| Characteristic | Share of public organizations |
|---|---|
| - | - |
| - | - |
| - | - |
| - | - |
The chart is not accessible to screen readers. Please switch to the table view to access the data.
Download
Source
Source
Release date
November 2018
More information
Region
Norway
Survey time period
2018
Number of respondents
11 respondents
Special properties
public organizations
Supplementary notes
The source provides the following information about the grading system:
0% Failed
20% Poor
40% Sufficient
60% Satisfactory
80% Very good
100 Outstanding
Citation formats