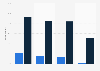
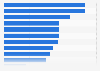
| Characteristic | Share of respondents |
|---|---|
| Product usability | 68% |
| Customer satisfaction | 50% |
| Brand equity | 25% |
| Revenue | 22% |
| Employee productivity | 18% |
| Conversions/ funnel metrics | 18% |
| Cost savings | 16% |
| Project specific metrics | 16% |
| Time to market | 14% |
| Entry into new markets | 9% |
| Design patents/ IP | 5% |
| Valuation/ share price | 2% |
The chart is not accessible to screen readers. Please switch to the table view to access the data.
January 2019
Worldwide
September 19 to October 4, 2018
2,229 respondents
large enterprises, small businesses, agencies and government and non-profit organizations
* Level 1 companies are 41 percent of overall respondents who had the lowest level of design adoption on a scale of one to five. The source labels these companies as 'Producers', with a design philosophy that design is what happens on screens. Level 1 companies are focused only on the most visible aspects of design 鈥� the pixels on the screen. At this level, organizations make early attempts to create efficiency and consistent story through visual identity guidelines but neglect processes, collaboration, and advanced tools.
Multiple answers were possible.
Original question: 鈥淥ur design team has had proven impact on: 鈥�