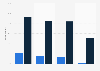
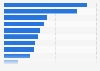
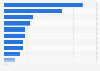
| Characteristic | Average number of designers |
|---|---|
| - | - |
| - | - |
| - | - |
| - | - |
| - | - |
The chart is not accessible to screen readers. Please switch to the table view to access the data.
January 2019
Worldwide
September 19 to October 4, 2018
2,090 respondents
large enterprises, small businesses, agencies and government and non-profit organizations
* Level of design adoption is ordered from one to five, with level one companies having the lowest level of adoption and level five companies having the highest. The proportion of respondents and design philosophy for each level is:
Level 1 companies: 41 percent, design is what happens on screens ('Producers')
Level 2 companies: 21 percent, design is what happens in a workshop ('Connectors')
Level 3 companies: 21 percent, design is a standardized scalable process ('Architects')
Level 4 companies: 12 percent, design is a hypothesis and an experiment ('Scientists')
Level 5 companies: 5 percent, design is business strategy ('Visionaries')
Multiple answers were possible.