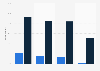
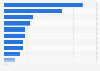
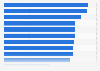
| Characteristic | Share of respondents |
|---|---|
| - | - |
| - | - |
| - | - |
| - | - |
| - | - |
| - | - |
| - | - |
| - | - |
| - | - |
| - | - |
| - | - |
| - | - |
The chart is not accessible to screen readers. Please switch to the table view to access the data.
January 2019
Worldwide
September 19 to October 4, 2018
2,229 respondents
large enterprises, small businesses, agencies and government and non-profit organizations
* Level 2 companies are the 21 percent of overall respondents who had the second-lowest level of design adoption on a scale of one to five. The source labels these companies as 'Connectors', with a design philosophy that design is what happens in a workshop. Design teams at Level 2 organizations have developed more collaborative processes, incorporating joint working sessions and integrated tooling with non-design peers. User research, user stories, usability testing, and personas are also more prevalent.
Multiple answers were possible.
Original question: 鈥淥ur design team has had proven impact on: 鈥�